Latest Post

Pepper futures slipped for the six trading sessions on the back of reports of Vietnam easing the prices of new crops and arrivals of Indian crops in the local market. The NMCE pepper for the February delivery ended the day at Rs 51,067, down Rs 383 or 0.74% over Friday`s close. Pepper futures are expected to extend the losses on profit taking and reports of flow of arrivals from India and Vietnam`s plan to sell at lower rates.

The adjoining chart is a weekly chart of NCDEX soya bean. Last week we saw soya bean traded within the range of the penultimate week and closed positive. Our sense is that it is in “wave IV” where we generally see a sideways consolidation. The weekly momentum indicators also bears a positive crossover which indicates a positive bias We expect the consolidation to break on the upside and achieve the equality target of Rs4,370 on the upside. Traders should keep a tight stoploss at Rs3,800, which is the low of the penultimate week when it had formed an Engulfing Bear Candle stick pattern.

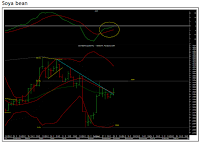
The adjoining chart is a weekly chart of NCDEX soya bean. We can observe that soya bean broke the trading range on the upside and it rallied smartly towards the crucial resistances. For the past five weeks, it has been oscillating around the crucial resistances. Last week we saw the agricommodity gave a positive weekly close and also closed above the resistance line (shown in blue colour). On a shorter time frame, we can observe that the agricommodity is consolidating in a range and has taken shape of a triangle, which has been broken on the upside. It faced resistance at the daily upper Bollinger Band and corrected once again. This indicates indecision among the market participants. The weekly momentum indicator has a positive crossover and reached the equilibrium line, which completes the pullback cycle. Our view on the agricommodity remains bearish and we expect soya bean to trade weak going ahead. Our targets on the downside are placed at Rs2,866, which is the weekly lower Bollinger Band. the stop loss should be trailed to Rs3,698, which is the 61.8% retracement level of the fall from Rs4,276 to Rs2,838.

The adjoining chart is a weekly chart of NCDEX jeera October contract. We can observe that jeera had formed an impulse on the downside. It retraced up to the 20- daily simple moving average and faced severe selling pressure at the crucial resistance. The weekly momentum indicator has given a negative crossover which indicates that every rise should be sold into. Currently it is trading near the lower end of the bearish flag pattern. Also a crucial medium term rising trend line (shown in blue colour) is providing it support. We expect the flag pattern to break on the downside with a target of Rs11,500 in the coming weeks. Our initial target placed at the weekly lower Bollinger Band has already been achieved. The stop loss should be placed at Rs13,800, which is the weekly upper Bollinger Band.

Author Name

Contact Form

Name

Email *

Message *

© All Rights Reserved 2008-2009,Shubhlaxmi Investments. Powered by Blogger.