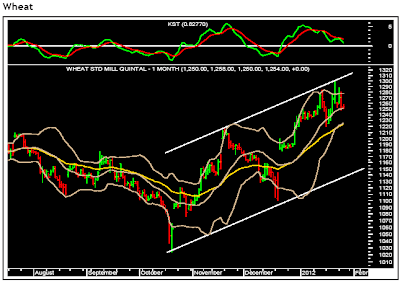
January 31, 2012 Wheat (NCDEX 1st month): A pause

As evident from the chart, the commodity has found resistance at the upper end of the daily Bollinger Band and is currently trading below its 20-daily moving average (Rs1,253). The daily momentum indicator is in sell mode indicating a halt in the uptrend that started from the lows of Rs1,100. Hence in the short term it is likely to correct lower towards Rs1,200, which will be the 50% retracement of the rise from Rs1,100-1,300. The reversal of the view is placed at Rs1,277 where the upper daily Bollinger Band is placed.

