2014-12-07

The adjacent chart shows the price movement of NCDEX RM seed 2-month contract. It has been moving up for the last few sessions. However it recently faced resistance near the upper channel line. From there it entered a correction mode. The daily momentum indicator has reached the overbought zone and needs to cool off. From a short-term perspective the agri commodity can come down till Rs.3,965 and Rs.3,915. On the other hand, the recent high of Rs.4,154 will act as a key resistance.

As can be seen from the adjacent chart, MCX mentha oil was trading in a medium-term downward sloping channel. Recently it has crossed the upper end of the channel and has retested it. Along with the channel line the key daily moving averages are there to provide support to the agri-commodity. At these supports the oil formed a bullish outside bar in the last session. Thus the commodity looks set to move higher. The key levels on the upside will be Rs740 and Rs.746. On the other hand, the swing’s low of Rs.691 will act as a key support on a closing basis.

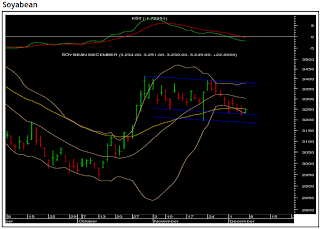
The adjacent chart shows the price movement of NCDEX soyabean December contract. For last few sessions the agri-commodity has been trading in sideways to a bearish manner. Currently it is trading near the lower end of a sideways channel. The junction of 40-day exponential moving average and the daily lower Bollinger Band is acting as an additional support. Thus the commodity seems to be forming a short term base. Rs3,217 and Rs3,196 is a key support zone. Till the time the support zone holds on a closing basis soyabean can move higher. The key levels on the upside will be Rs3,300 and Rs3,370.

Author Name

Contact Form

Name

Email *

Message *

© All Rights Reserved 2008-2009,Shubhlaxmi Investments. Powered by Blogger.