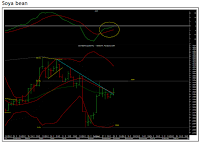
Soya bean consolidating in a range
The adjoining chart is a weekly chart of NCDEX soya bean. Last week we saw soya bean traded within the range of the penultimate week and closed positive. Our sense is that it is in “wave IV” where we generally see a sideways consolidation. The weekly momentum indicators also bears a positive crossover which indicates a positive bias We expect the consolidation to break on the upside and
achieve the equality target of Rs4,370 on the upside. Traders should keep a tight stoploss at Rs3,800, which is the low of the penultimate week when it had formed an Engulfing Bear Candle stick pattern.


