Latest Post


The adjoining chart is of NCDEX gram chana October contract. We can observe that gram chana was trading in an upward sloping channel which broke on the downside. For the past few trading sessions it has been trading in a sideways manner. Our sense is that it is forming a triangle and we expect it to break on the upside. The daily momentum indicator has been oscillating around the equilibrium line which is in sync with the price action. So the strategy to trade gram chana is to buy on decline near the Rs3,000 level which is the daily lower Bollinger Band for the targets of Rs3,240, which is the swing’s high and above that we expect Rs3,400, which is the weekly upper Bollinger Band. The reversal of the bullish stance is placed below Rs2,875, which is the 50% retracement of the rise.

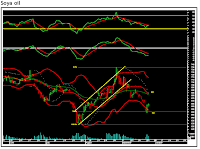
The adjoining chart is of NCDEX soya oil October contract. We can observe that soya oil has been correcting sharply for the past few weeks. In the penultimate trading session it formed an engulfing bull candlestick pattern which has bullish implications. In our previous report on soya oil we had forecast that soya oil would correct up to Rs650 which was the 78.6% retracement of the fall. It achieved the target. Going ahead we expect soya oil to trade positive for the target of Rs682, which is the area of 20- and 40-daily moving averages. The reversal of the bullish stance is placed below Rs648, which is the low of the engulfing bull candlestick pattern. And below this level the pattern will get negated.

The adjoining chart is a chart of NCDEX jeera October contract. We can observe that jeera had formed an impulse on the downside. It retraced up to the 20-daily simple moving average (DSMA) and faced severe selling pressure at the crucial resistance. The daily momentum indicator has a negative crossover which indicates that every rise should be sold into. In the last trading session it broke below the previous swing’s low which indicates that the next leg on the downside has already begun which should take the agri-commodity to the daily lower Bollinger Band placed at Rs12,777 and below that we expect the target of Rs12,170, which is the equality target. The stop loss should be placed at Rs13,445, which is the 20-DSMA.

The adjoining chart is a weekly chart of NCDEX soya bean. We can observe that soya bean broke the trading range on the upside and rallied smartly towards the crucial resistances. It faced resistance at the 20-weekly simple moving average and closed negative for the last week which indicates weakness to surpass the crucial resistance placed at the 20- and 40-weekly moving averages. It has also faced resistance at the downward sloping trend line (shown in blue colour) which will act as a key resistance going ahead. The weekly momentum indicator bears a positive crossover and we feel it will touch the equilibrium line which completes the pull-back cycle. Our view on the agri-commodity remains bearish and we expect soya bean to trade weak going ahead. Our target on the downside are placed at Rs2,836, which is the weekly lower Bollinger Band. The stop loss should be trailed to Rs3,698, which is the high level of penultimate week.

Author Name

Contact Form

Name

Email *

Message *

© All Rights Reserved 2008-2009,Shubhlaxmi Investments. Powered by Blogger.