Jeera in grip of bears
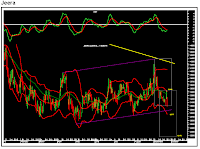
The adjoining chart is a chart of NCDEX jeera October contract. We can observe that jeera had formed an impulse on the downside. It retraced up to the 20-daily simple moving average (DSMA) and faced severe selling pressure at the crucial resistance. The daily momentum indicator has a negative crossover which indicates that every rise should be sold into. In the last trading session it broke below the previous swing’s low which indicates that the next leg on the downside has already begun which should take the agri-commodity to the daily lower Bollinger Band placed at Rs12,777 and below that we expect the target of Rs12,170, which is the equality target. The stop loss should be placed at Rs13,445, which is the 20-DSMA.


