2014

The adjacent chart shows the price movement of NCDEX soya oil January contract. The agri-commodity is moving up in a medium-term rising channel. Within that channel it had formed a short-term falling channel. Recently it has broken-out from the falling channel. The daily momentum indicator is in line with the bullish breakout. The key level on the upside will be Rs.632, ie the upper end of the rising channel. The swing’s high of Rs.615.20 will act as an intermediate resistance. On the other hand, Rs.603 and Rs.596 will act as the key support zone.

The adjacent chart shows price movement of NCDEX cottonseed oilcake January contract. In last few sessions the agri-commodity has formed a short-term correction. It has taken support near the key daily moving averages. From there the commodity seems to have started next leg on the upside. The daily momentum indicator is in bullish mode. Once the swing’s high of Rs1,436 is crossed the price can head up till Rs1,453 and Rs1,487. On the other hand, Rs1,396 and Rs1,390 will act as a key support zone

As can be seen from the adjacent chart, MCX mentha oil was trading in a medium-term downward sloping channel. Recently it crossed the upper end of the channel and retested it. Along with the channel line key daily moving averages acted as crucial supports for the agri commodity. At these supports the oil formed a bullish outside bar on the daily chart. As a follow through mentha oil has started a fresh move on the upside. It is forming higher tops higher bottoms on the daily chart, which is a bullish sign. The daily momentum indicator is in line with the price action. The key level on the upside will be Rs.746. On the other hand, Rs.708 and Rs703 will act as a key support zone.

The adjacent chart shows price movement of NCDEX chana 2-month contract. It has formed short-term correction, which has retraced 50% of the previous up move. Near the key Fibonacci level it found support at various parameters. From there the agri-commodity has started the next leg up. The short-term momentum indicators are in bullish mode. From a short-term perspective chana is expected to test the high of Rs.3,287. Once the high is crossed it will be poised for a larger upside. The subsequent level on the upside will be Rs3,458. On the other hand, Rs.3,090 and Rs.3,034 will act as a key support zone.

The adjacent chart shows the price movement of NCDEX RM seed 2-month contract. It was moving up for last several sessions. However it faced resistance near the upper channel line. From there it has entered a correction mode. The daily momentum indicator that had been stretched to the overbought zone has triggered bearish crossover. On the downside junction of 20-day moving average and the lower channel line ie Rs.3,950 and Rs3,935 will be the key area to watch out for. On the other hand, Rs4,093 and Rs4,110 will act as a key resistance zone


The adjacent chart shows the price movement of NCDEX soya oil 2-month continuous contract. For the last few sessions it is facing resistance near the key daily moving averages. Structurally it is poised for the next leg down. In the last session it has formed a bearish Belt Hold candle. Thus the agri-commodity is expected to fall towards the low of Rs.585.50. The equality target on the downside comes to Rs.565. On the higher side, the swing’s high of Rs.593.80 will act as a key resistance on a closing basis.

The adjacent chart shows the price movement of NCDEX RM seed 2-month contract. It has been moving up for the last few sessions. However it recently faced resistance near the upper channel line. From there it entered a correction mode. The daily momentum indicator has reached the overbought zone and needs to cool off. From a short-term perspective the agri commodity can come down till Rs.3,965 and Rs.3,915. On the other hand, the recent high of Rs.4,154 will act as a key resistance.

As can be seen from the adjacent chart, MCX mentha oil was trading in a medium-term downward sloping channel. Recently it has crossed the upper end of the channel and has retested it. Along with the channel line the key daily moving averages are there to provide support to the agri-commodity. At these supports the oil formed a bullish outside bar in the last session. Thus the commodity looks set to move higher. The key levels on the upside will be Rs740 and Rs.746. On the other hand, the swing’s low of Rs.691 will act as a key support on a closing basis.

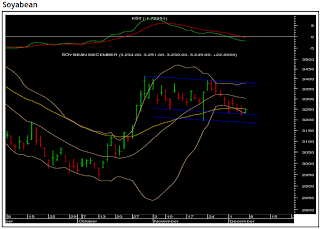
The adjacent chart shows the price movement of NCDEX soyabean December contract. For last few sessions the agri-commodity has been trading in sideways to a bearish manner. Currently it is trading near the lower end of a sideways channel. The junction of 40-day exponential moving average and the daily lower Bollinger Band is acting as an additional support. Thus the commodity seems to be forming a short term base. Rs3,217 and Rs3,196 is a key support zone. Till the time the support zone holds on a closing basis soyabean can move higher. The key levels on the upside will be Rs3,300 and Rs3,370.

Jeera futures ended the day lower on short selling amid higher arrivals. The NCDEX Jeera April delivery ended the day at Rs9965, down Rs 125 or 1.24% over last close. Cumin seed is likely to drop further on bounty crop amid weak export demand at present.

The market sources suggested that the total domestic Jeera production is estimated at 55-60 lakh bags in the current year against the previous estimates of 45-48 lakh bags. This is mainly due to strong production estimates in Gujarat. The prices will also be pressurized by fresh supplies in local mandies. Traders are expecting that arrivals are likely to gain momentum in the coming days on the account of rising new supplies from Rajasthan.


Jeera failed to recover further as short selling emerged triggered by higher arrivals. The counter touched almost six year low with prices hitting low of Rs 9870 level. The counter ended the day at Rs9965, down Rs 125 or 1.24% over last close and the open interest added 147 tonnes to 9,699 tonnes, indicating short selling. Technically, the counter is likely to find support at Rs 9870, Rs 9800 and resistance is at Rs 10,000, Rs 10,100 per quintal.

The adjoining chart is of NCDEX soya oil March contract. We can observe that soya oil has been in a short-term uptrend for the past couple of weeks. It has been forming higher tops and higher bottoms on the daily charts which indicates an uptrend. The daily momentum indicator has a positive crossover and is currently trading above the 20- and 40-daily moving averages. Our initial target of Rs709 has been achieved. Traders are advised to trail their stop loss at Rs702 to protect their profits. The targets on the upside are Rs718 and Rs728.

Cardamom spurted further on the report of strong export demand. The spice continued it`s up trend for the sixth consecutive trading sessions with the futures hitting upper circuit in the last two sessions.MCX Cardamom for the February delivery ended the day at Rs 787.40, up Rs 30.20 or 3.99%. Technically, the counter is at overbought position as on Thursday close (the 14-day RSI is at 85 levels) and so a pull back can be expected in the coming sessions. Therefore, further acquisition of long positions should be careful.

As per the latest spices export data released by the spices board of India, India exported small Cardamom of 1,805 MT valued at Rs. 144.35 crore during the period April to November 2013, jumped 38% and 22% respectively in volume and value of exports. Indian crop also better on favorable weather this year and the next picking is just starting. The overall arrivals in the auctions in India so far 20th January 2014 are estimated at 13,264 tonnes, against 6,787 tonnes same period last year. The harvesting of the new crop had just started in Guatemala. Crop size is similar to last year.

The adjoining chart is a weekly chart of NCDEX jeera March 2014 contract. Jeera made a sharp pullback towards the medium-term rising trendline (shown in blue colour) after completing a five-wave decline on the downside. The agri-commodity has faced resistance at the crucial 61.8% retracement level and sold off from there. Last week we saw the agri-commodity traded in a volatile manner and closed the week with marginal gains. It was unable to close above the crucial weekly moving averages which indicates that the weakness still persists. We expect jeera to trade weak for the targets of Rs.11895, which is the previous swing’s low, and Rs11,275, which is the next swing’s low. The stop loss should be trailed to Rs12,947, which is the swing’s high.

Pepper futures slipped for the six trading sessions on the back of reports of Vietnam easing the prices of new crops and arrivals of Indian crops in the local market. The NMCE pepper for the February delivery ended the day at Rs 51,067, down Rs 383 or 0.74% over Friday`s close. Pepper futures are expected to extend the losses on profit taking and reports of flow of arrivals from India and Vietnam`s plan to sell at lower rates.

Author Name

Contact Form

Name

Email *

Message *

© All Rights Reserved 2008-2009,Shubhlaxmi Investments. Powered by Blogger.