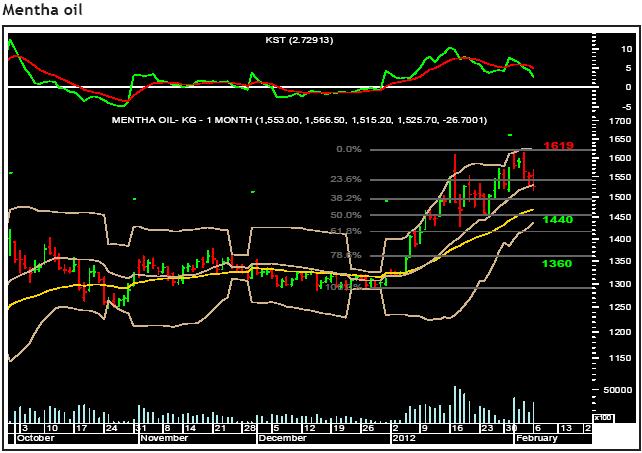
The adjoining is a continuous chart of MCX Mentha oil.We can observe that Mentha oil after giving a break out of the triangle has given a run up sharply and is nearing
its crucial resistances plac...
The following chart is of MCX mentha oil October contract.Mentha oil has been correcting sharply for the past few trading sessions. Currently it is trading near its crucial support zone placed aro...
MCX Potato has been in an uptrend. However the rally seems to have matured at least from the short-term perspective. It has recently formed an ending diagonal. The last leg of the patte...
NCDEX Chilli is falling towards the long-term rising trendline. The commodity had taken support near a medium-term falling trendline however it could not surpass the 20-DMA. In terms of the wave struc...
Since Jeera has broken down from the wedge pattern it has fallen sharply. The fall is unfolding in a channelised manner and is breaking up into lower degree waves. Recently a lower degree fourth wave ...
Soybean broke out from the triangle on the upside and rallied towards the previous highs. It halted there for a week and ultimately surpassed the hurdle of Rs2,824 and Rs2,826. The brea...
After falling from Rs6,612 to Rs3,688, NCDEX dhaniya formed a bearish triangle. The last leg of the pattern got over near the key resistance zone of 40-weekly exponential moving average...
NCDEX RM Seed is trading in a long-term rising channel.It recently overshot the upper channel line twice; however it couldn’t sustain there. The daily as well as the weekly momentum indicators didn’t ...
MCX mentha oil in the last few months had run up sharply. After achieving multiple equality targets the commodity has formed a channelised correction. The correction found support at the crucial suppo...
After the first leg of the fall, ie. from Rs766.9 to 674, NCDEX refined soy oil formed a pullback. The wave structure shows that it was a complex corrective structure. In terms of Fibonacci retracemen...
Crude palm oil had taken support at the rising trendline. Since then it has been riding the up trend. However recently it has formed an ending diagonal and has broken on the downside. This indicates t...
Jeera has been in a downtrend. It has broken the rising trendline decisively. Thus it has broken down from the wedge pattern. It has fallen towards the weekly lower Bollinger Band, which is expanding,...
Soya bean has given a breakout from a triangle formation on the weekly charts. Soya bean is trading well above its 20- and 40-weekly moving averages of Rs2,427 and Rs2,410 respectively. The momentum i...
NCDEX pepper was trading near the lower end of the medium-term rising channel. The weekly lower Bollinger Band provided support to the agri commodity and push it up. The price has crossed the 40-Weekl...
NCDEX chana was trading in a range bound manner for several weeks. The consolidation formed a large triangle and broke out on the upside. It has also retested the trendline and has resumed the rally. ...
Jeera has fallen below the 20-weekly moving average (WMA; Rs14,558) and the 40-weekly exponential moving average (WEMA; Rs14,763), which are now acting as resistances. Jeera is falling down as a follo...
The NCDEX guar seed has been trading in a range. Structurally it is forming a triangle. The 20-daily moving average and the lower end of the rising channel are there to provide support. In the time th...
MCX mentha oil has started correcting from the high of Rs1,619. It has fallen from the daily upper Bollinger Band towards the 20-daily moving average. In the last week it had formed a doji at weekly u...
As evident from the chart, the commodity has been finding support near its 50% Fibonacci retracement level that is around Rs2,437. For the last couple of trading sessions it has been finding support n...
As evident from the chart, the commodity has found resistance at the upper end of the daily Bollinger Band and is currently trading below its 20-daily moving average (Rs1,253). The daily momentum indi...
NCDEX wheat has been trading near the 20-daily moving average and the daily upper Bollinger Band for the last few sessions. It recently faced resistance near the upper end of a rising channel. The dai...
The NCDEX cotton seed oilcake seems to have completed a three-wave pull-back. It has done a deep retracement of the previous fall. From the upper end of the channel the agri-commodity is now expected ...
As evident from the chart, the commodity is nearing the 20-weekly moving average, which is currently placed at Rs4,605. Hence this would be a key make or break level and once the price closes above th...
As evident from the chart, the commodity is nearing the key resistance zone of 50% retracement level, which is currently placed at Rs3,276, and the gap area (Rs3,297). Also the 40-daily exponential mo...
As evident from the chart, the commodity has been correcting from the high of Rs2,659 and is now nearing the key support zone of 50% retracement level of Rs2,214- 2,660 swing. The daily momentum indic...