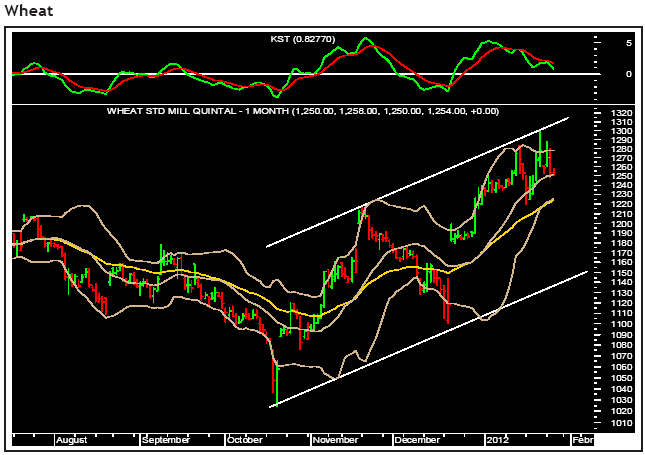
Latest Post

NCDEX wheat has been trading near the 20-daily moving average and the daily upper Bollinger Band for the last few sessions. It recently faced resistance near the upper end of a rising channel. The daily Bollinger Bands are squeezing and the daily momentum indicator shows that they are likely to expand in favour of bears. The key resistances on the upside are Rs1,287-1,300. On the flip side the agri commodity is expected to test the 40-daily exponential moving average, the daily lower Bollinger Band (Rs1,225) and below that the 40-weekly exponential moving average (Rs1,185).

The NCDEX cotton seed oilcake seems to have completed a three-wave pull-back. It has done a deep retracement of the previous fall. From the upper end of the channel the agri-commodity is now expected to travel southward. The daily momentum indicator has given a sell signal from an overbought level. The intermediate and lower channel lines are near Rs1,260-1,215 respectively. The reversal has been kept at Rs1,360.


As evident from the chart, the commodity is nearing the 20-weekly moving average, which is currently placed at Rs4,605. Hence this would be a key make or break level and once the price closes above this area on a weekly basis it is likely to target Rs4,865/5,211. The momentum cycles are in buy mode on weekly and daily time frames suggesting bulls have an upper hand in the short and medium term. Hence any correction should find support at the 20-daily moving average, which is currently placed at Rs4,120.


As evident from the chart, the commodity is nearing the key resistance zone of 50% retracement level, which is currently placed at Rs3,276, and the gap area (Rs3,297). Also the 40-daily exponential moving average is placed at Rs3,295 and hence it is the major hurdle for bulls going forward. On the lower side, it is likely to retest the lower trend line around Rs3,044 in the short term.

Author Name

Contact Form

Name

Email *

Message *

© All Rights Reserved 2008-2009,Shubhlaxmi Investments. Powered by Blogger.