Articles by "Soya Oil"

Showing posts with label Soya Oil. Show all posts


Soya oil: Correction mode

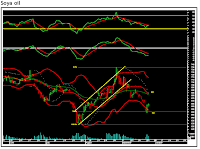
Adjacent chart shows price movement of NCDEX soya oil continuous contract. Structurally the oil formed a multimonth triangle, which broke out on the upside. From there the oil rallied nicely. The up move got over at 682.70. From there the agri-commodity has entered correction mode. The daily momentum indicator is in bearish mode. A minor degree bounce faced resistance near the key daily moving averages (DMAs). Thus the next leg down is expected to start off, which can target Rs621-615.5. on the flip side, Rs652-657 is a key resistance zone on a closing basis.


Adjacent chart shows the price movement of NCDEX soya oil continuous contract. Structurally, the oil formed a multi month triangle, which broke out on the upside. Since then the oil rallied nicely. However the up move looks complete at Rs 682.70. From there the agri-commodity has entered short-term correction mode. The daily momentum indicator is showing negative divergence and has given a fresh sell signal. Thus soya oil can come down to test the daily lower Bollinger Band, ie Rs 635.


The adjacent chart shows price movement of NCDEX soya oil August contract. From the high of Rs.616.6, soya oil has been heading towards south. On the occasions of minor degree bounces it has been facing resistance near the key day moving averages. Recently it faced resistance there and has started falling down. The fall is breaking up into lower degree waves. The medium term momentum indicator is in line with the fall, whereas the daily momentum indicator has triggered a fresh bearish crossover. Thus unless the level of Rs.583 is crossed the agri-commodity is expected to trade with downward bias. The key levels on the downside will be Rs.566.80 and Rs.555.50.

The adjacent chart shows the price movement of NCDEX soya oil January contract. The agri-commodity is moving up in a medium-term rising channel. Within that channel it had formed a short-term falling channel. Recently it has broken-out from the falling channel. The daily momentum indicator is in line with the bullish breakout. The key level on the upside will be Rs.632, ie the upper end of the rising channel. The swing’s high of Rs.615.20 will act as an intermediate resistance. On the other hand, Rs.603 and Rs.596 will act as the key support zone.


The adjacent chart shows the price movement of NCDEX soya oil 2-month continuous contract. For the last few sessions it is facing resistance near the key daily moving averages. Structurally it is poised for the next leg down. In the last session it has formed a bearish Belt Hold candle. Thus the agri-commodity is expected to fall towards the low of Rs.585.50. The equality target on the downside comes to Rs.565. On the higher side, the swing’s high of Rs.593.80 will act as a key resistance on a closing basis.

The adjoining chart is of NCDEX soya oil March contract. We can observe that soya oil has been in a short-term uptrend for the past couple of weeks. It has been forming higher tops and higher bottoms on the daily charts which indicates an uptrend. The daily momentum indicator has a positive crossover and is currently trading above the 20- and 40-daily moving averages. Our initial target of Rs709 has been achieved. Traders are advised to trail their stop loss at Rs702 to protect their profits. The targets on the upside are Rs718 and Rs728.

The adjoining chart is of NCDEX soya oil October contract. We can observe that soya oil has been correcting sharply for the past few weeks. In the penultimate trading session it formed an engulfing bull candlestick pattern which has bullish implications. In our previous report on soya oil we had forecast that soya oil would correct up to Rs650 which was the 78.6% retracement of the fall. It achieved the target. Going ahead we expect soya oil to trade positive for the target of Rs682, which is the area of 20- and 40-daily moving averages. The reversal of the bullish stance is placed below Rs648, which is the low of the engulfing bull candlestick pattern. And below this level the pattern will get negated.

The following chart is of NCDEX soy oil April contract. We can observe that soy oil has faced resistance at the 20- daily simple moving average (DSMA) and sold off from there. It has broken its previous swing low and the fall has been extended. The momentum indicators have a negative crossover and soy oil is also trading below the crucial daily averages. Thus we expect the agri commodity to trade with a negative bias for the target of Rs644 on the downside, which is the previous swing low. The reversal can be trailed at Rs681, the 20-DSMA.

After the first leg of the fall, ie. from Rs766.9 to 674, NCDEX refined soy oil formed a pullback. The wave structure shows that it was a complex corrective structure. In terms of Fibonacci retracement the pullback retraced nearly 78.6% of the fall. The agri commodity is now set for the next leg down. The daily momentum indicator is also showing a negative divergence. Unless the key Fibonacci retracement (Rs748) is crossed on a closing basis the targets on the downside are Rs674 (the low) and Rs654 (the equality target).

Author Name

Contact Form

Name

Email *

Message *

© All Rights Reserved 2008-2009,Shubhlaxmi Investments. Powered by Blogger.