Articles by "Soya Been"

Showing posts with label Soya Been. Show all posts


For several weeks NCDEX soybean was oscillating about the key DMAs. In terms of price patterns, the agri-commodity formed a triangular pattern, which broke out on the upside. Since the breakout the commodity has been marching towards north. It consolidated near the previous high of Rs4,121 and 78.6% retracement mark for few days and started moving higher. The commodity is moving up in a channelised manner. The subsequent levels on the upside will be Rs 4,412 and Rs 4,560. The level of Rs 4,121 will act as a crucial support on a closing basis


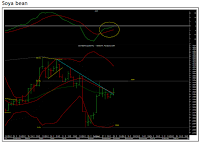
The adjacent chart shows price movement of NCDEX soybean continuous contract. From the high of Rs.4,412 it has entered correction mode. The fall is breaking up into lower degree waves. Recently the agri-commodity formed a minor degree bounce, which faced resistance near the key daily and weekly moving averages. The upper end of the reverse falling channel is also restricted the bulls. Thus the price has started falling again. On the downside Rs3,408-3,400 is acting as a key support zone. Once that breaks, the price can tumble down till Rs3,325- 3,300. On the other hand, Rs3,547-3,580 will act as a key resistance zone.

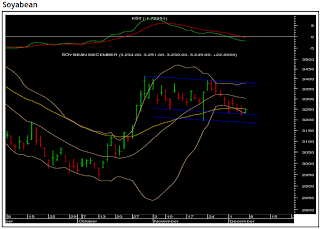
The adjacent chart shows the price movement of NCDEX soyabean December contract. For last few sessions the agri-commodity has been trading in sideways to a bearish manner. Currently it is trading near the lower end of a sideways channel. The junction of 40-day exponential moving average and the daily lower Bollinger Band is acting as an additional support. Thus the commodity seems to be forming a short term base. Rs3,217 and Rs3,196 is a key support zone. Till the time the support zone holds on a closing basis soyabean can move higher. The key levels on the upside will be Rs3,300 and Rs3,370.

The adjoining chart is a weekly chart of NCDEX soya bean. Last week we saw soya bean traded within the range of the penultimate week and closed positive. Our sense is that it is in “wave IV” where we generally see a sideways consolidation. The weekly momentum indicators also bears a positive crossover which indicates a positive bias We expect the consolidation to break on the upside and achieve the equality target of Rs4,370 on the upside. Traders should keep a tight stoploss at Rs3,800, which is the low of the penultimate week when it had formed an Engulfing Bear Candle stick pattern.

The adjoining chart is a weekly chart of NCDEX soya bean. We can observe that soya bean broke the trading range on the upside and it rallied smartly towards the crucial resistances. For the past five weeks, it has been oscillating around the crucial resistances. Last week we saw the agricommodity gave a positive weekly close and also closed above the resistance line (shown in blue colour). On a shorter time frame, we can observe that the agricommodity is consolidating in a range and has taken shape of a triangle, which has been broken on the upside. It faced resistance at the daily upper Bollinger Band and corrected once again. This indicates indecision among the market participants. The weekly momentum indicator has a positive crossover and reached the equilibrium line, which completes the pullback cycle. Our view on the agricommodity remains bearish and we expect soya bean to trade weak going ahead. Our targets on the downside are placed at Rs2,866, which is the weekly lower Bollinger Band. the stop loss should be trailed to Rs3,698, which is the 61.8% retracement level of the fall from Rs4,276 to Rs2,838.

The adjoining chart is a weekly chart of NCDEX Soya bean. We can observe that soya bean broke the trading range on the upside and rallied smartly towards the crucial resistances. It has faced resistance at the 20- and 40-weekly moving average. Last week the agricommodity gave a positive weekly close. However, it was unable to surpass the crucial moving averages. On a shorter time frame we can observe that the agricommodity is consolidating in a range and has taken the shape of a triangle. We expect this consolidation to break on the downside. It has also faced resistance at the wnward sloping trendline (shown in blue colour) which will act as a key resistance going ahead. The weekly momentum indicator bears a positive crossover and we feel it will touch the equilibrium line which completes the pull-back cycle. Our view on the agri-commodity remains bearish and we expect soya bean to trade weak going ahead. Our target on the downside is placed at Rs2,845, which is the weekly lower bollinger band. The stop loss should be trailed to Rs3,698, which is the swing’s high.

The adjoining chart is a weekly chart of NCDEX soya bean. We can observe that soya bean broke the trading range on the upside and rallied smartly towards the crucial resistances. It faced resistance at the 20-weekly simple moving average and closed negative for the last week which indicates weakness to surpass the crucial resistance placed at the 20- and 40-weekly moving averages. It has also faced resistance at the downward sloping trend line (shown in blue colour) which will act as a key resistance going ahead. The weekly momentum indicator bears a positive crossover and we feel it will touch the equilibrium line which completes the pull-back cycle. Our view on the agri-commodity remains bearish and we expect soya bean to trade weak going ahead. Our target on the downside are placed at Rs2,836, which is the weekly lower Bollinger Band. The stop loss should be trailed to Rs3,698, which is the high level of penultimate week.


Soybean broke out from the triangle on the upside and rallied towards the previous highs. It halted there for a week and ultimately surpassed the hurdle of Rs2,824 and Rs2,826. The breakout occurred along with high volumes. Consequently the agri-commodity achieved and even surpassed both the equality targets. Though the momentum indicators are in an overbought territory they are holding strong and unless weakness is seen in the price action the rally is likely to continue. From medium-term perspective 161.8% retracement mark (Rs3,580) and upper end of the rising channel (Rs3,830) will be the targets. On the other hand, Rs3,146 will be the reconsideration level.


Soya bean has given a breakout from a triangle formation on the weekly charts. Soya bean is trading well above its 20- and 40-weekly moving averages of Rs2,427 and Rs2,410 respectively. The momentum indicators have given a positive crossover and are above the equilibrium line. We are expecting Soya bean to trade with a positive bias with target of Rs2,949 in the short term with the key reversal levels at Rs2,668.

As evident from the chart, the commodity has been finding support near its 50% Fibonacci retracement level that is around Rs2,437. For the last couple of trading sessions it has been finding support near this area. Going forward,the immediate resistance is placed at Rs2,490, which is the falling trend line resistance. Once that is taken off bulls will take charge of this commodity and head higher towards Rs2,470 and Rs2,606. The reversal of this view is placed at Rs2,399, which is 61.8% retracement level.


As evident from the chart, the commodity has been correcting from the high of Rs2,659 and is now nearing the key support zone of 50% retracement level of Rs2,214- 2,660 swing. The daily momentum indicator is in sell mode but is likely to finish its down cycle in the coming few days. Also, the prices are nearing the lower daily Bollinger Band that is currently placed at Rs2,460. Hence the area of Rs2,437-2,460 is likely to act as a key support area in the short term. Aggressive traders can accumulate in this area with a stop placed at Rs2,385 (61.8% retracement) on a closing basis.

Author Name

Contact Form

Name

Email *

Message *

© All Rights Reserved 2008-2009,Shubhlaxmi Investments. Powered by Blogger.